Vertical Weather
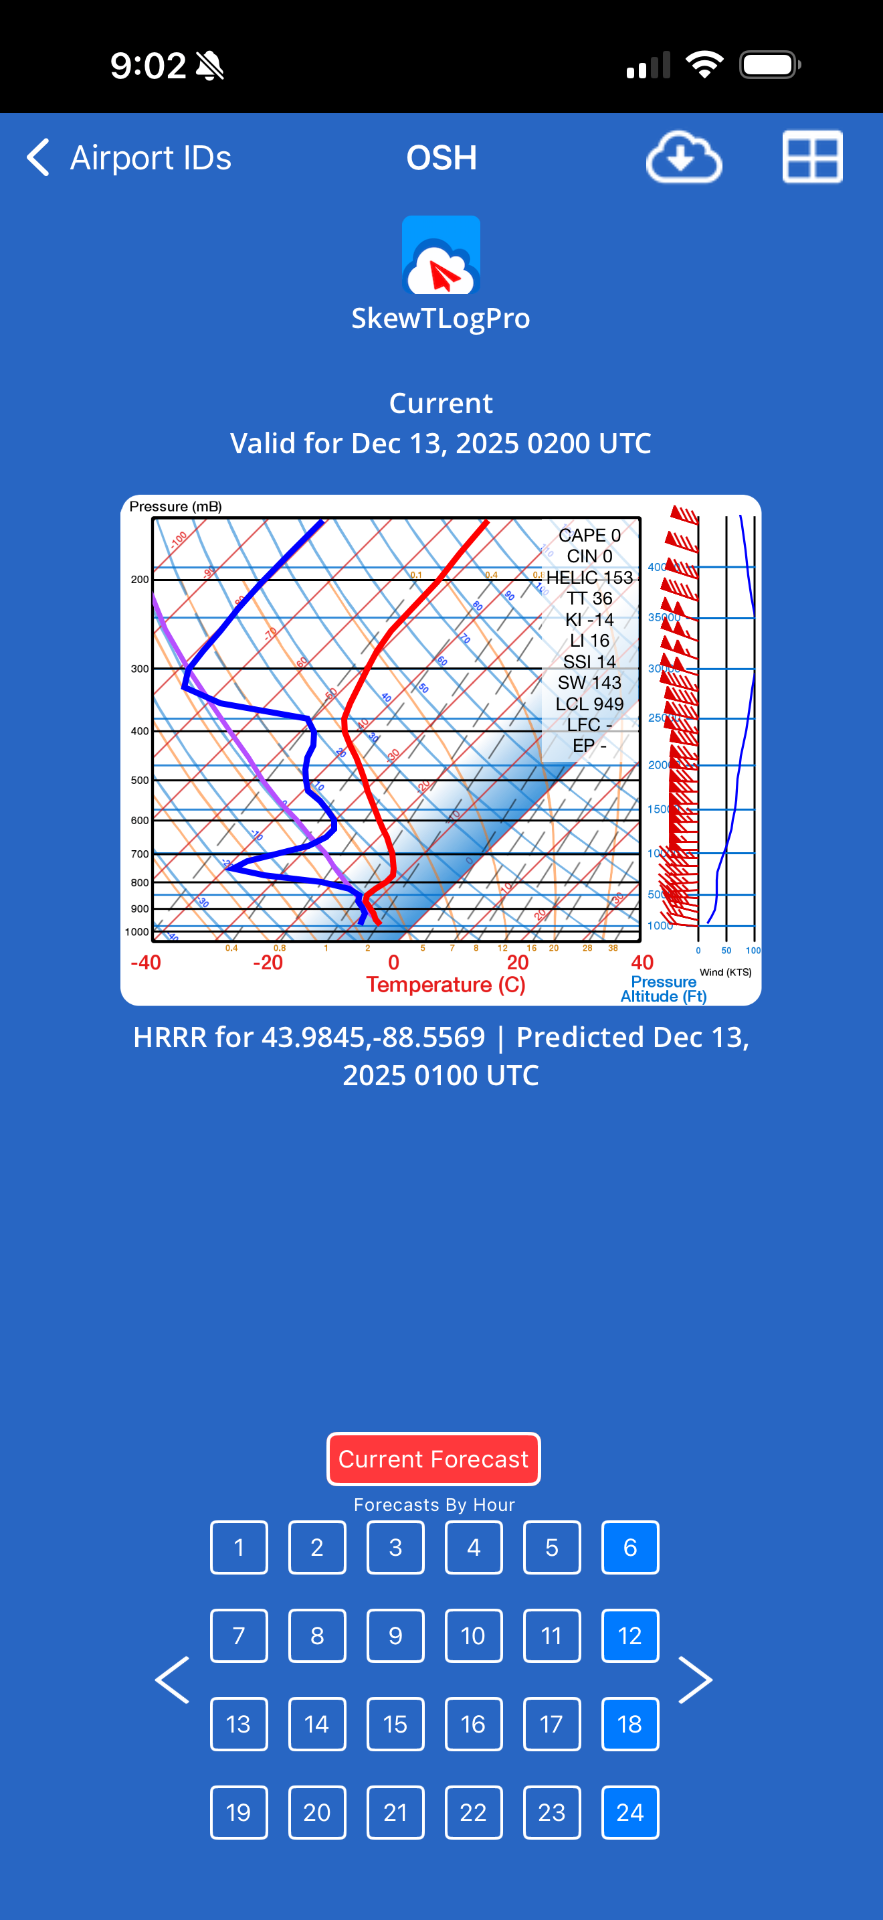
The primary feature in each of the charts below is the large graph and its associated elements in the upper left rectangle. Most of the remaining components of the chart are derived from the same data used to build that graph.
The graph's vertical axis is altitude, given in millibars. See the table above for translation into altitude in feet. It is shown on a logarithmic scale; hence the "Log-P" in the term "Skew-T Log-P chart".
The graph's horizontal axis is temperature, in degrees Centigrade. Note that on the graph itself, the vertical lines to indicate temperature slant to the right; hence the "Skew-T" in the term "Skew-T Log-P chart". The skewing is due to the fact that the atmospheric temperature declines about two degrees per thousand feet increase. For any given temperature on the X axis, look vertically for the corresponding expected temerature at any given altitude: if it is 20 degrees Centigrade at 1000 feet, expect the temperature at 10,000 feet to be 2 degrees.
The Chart's Contents
The red line indicates the temperature at each altitude for that location.
The green line indicates the dew point at each altitude for that location.
Note that the bottom ends of the red and green lines stop at a particular altitude, not at the bottom of the graph itself. That particular altitude reflects the ground level at that location.
The closer the green line is to the red line, the higher the relative humidity at that altitude. If they overlap, that indicates 100% relative humidity.
At that altitude there will be clouds (at ground level, fog). If the two lines are far apart, clear skies will be present at that altitude.
SkewTLogPro forecast charts indicate conditions for a 20-kilometer by 20-kilometer (13-mile by 13-mile) square. Obviously, variations of the conditions within that square will occur.
The closer together the red and green lines are, the more clouds will form, transitioning from clear skies when the lines are far apart, to scattered clouds to broken clouds to overcast as the lines converge.
Freezing Level
The dotted blue lines at 0 degrees and -20 degrees indicate the freezing level, which is very important for aviation.
If clouds are present where the temperature line crosses the 0 degree line, and is within the 0-degree to -20-degree range, expect super-cooled water droplets, and subsequent icing. That possibility progressively declines with the drop in temperature away from 0 degrees.
The likelihood of icing also drops depending on air movement. In very calm air, water can remain liquid to a much colder temperature. But air movement, whether due to the flight of an airplane or due to natural causes, such as flow over mountains or the movement of a front, causes disturbance and air movement which will result in the freezing of those liquid droplets. Once frozen (i.e., as snow), that moisture is no longer of concern regarding icing on wing surfaces. As snow however, it can clog air intakes.
Winds Aloft
The wind barbs to the right of the main chart indicate direction and speed of the winds at each altitude.
Of primary interest are high winds, which result in turbulence, or changes in wind direction and speed with altitude, which indicates wind shear. Progressive, minimal changes indicates smoother flying. Rapid, more radical changes indicate turbulence and wind shear.
CAPE and Cumulonimbus Clouds
The thin dotted brown line that typically lies between the red and green lines indicates Convective Available Potential Energy: CAPE.
When the dotted brown CAPE line is to the right of the red Temperature line, convective activity can be expected.
Cumulus clouds will build to altitudes above what the areas of convergence of the red Temperature line and the green Dew Point line would indicate, forming cumulonimbus clouds. Turbulence in such clouds is likely to be severe.
Levels of Turbulence
Light Small, correctable deviations from position and altitude. Aircraft control is maintained.
Moderate Significant deviations from position and altitude. Momentary losses of control of aircraft.
Severe Uncontrollable deviations from position and altitude. Loss of control of aircraft; possible deformation and destruction of aircraft.
Boundaries Between Air Masses
Cloud bases or tops will often indicate boundaries between two air masses. If all cloud bases or (more rarely) all cloud tops are at the same altitude, that is the dividing line between two air masses with differing wind speed, direction, temperature, and relative humidity.
Ground Thermals
On clear, sunny days, the heating of the earth will cause ground thermals rising columns of air that late in the afternoon can reach up to 4,000' above ground level (AGL) and be a bit bumpy. Cloud bases will often form at that level as ground humidity reaches the cooler air above the thermals.
More generally, on Skew-T Log-P charts this is called the Lifting Condensation Level (LCL), defined as the level at which a lifted parcel of air becomes saturated (i.e., due to cooling bringing the temperature down to be equal to the dew point). The LCL is a reasonable estimate of cloud base height when air parcels experience forced ascent.
Multiple Cloud Layers
If clouds are indicated at two levels for example, a layer at 30,000 feet and another below 5,000 feet then the upper cloud layer will typically block the sun's warmth from reaching the lower layer of clouds. Flying through the lower layer should be fairly smooth (assuming no turbulence due to winds).
Without a shielding cloud layer, the sun's warmth typically makes that lower level of clouds increasingly more turbulent as the daytime hours progress.
Daily Atmospheric Changes
The day's weather is most calm from about 3:00am until sunrise. The heat of the previous day has radiated away, and with sunrise the clouds and ground begin to warm again, creating atmospheric changes.
Obviously, strong fronts, hurricanes, etc., continue througout the night with enough force not to be significantly abated. The movement of air masses across the earth's surface is not affected as much by the sun's radiation; their substantial mass has substantial inertia, and does not stop.

:max_bytes(150000):strip_icc()/weather_fronts-labeled-nws-58b7402a3df78c060e1953fd.png)