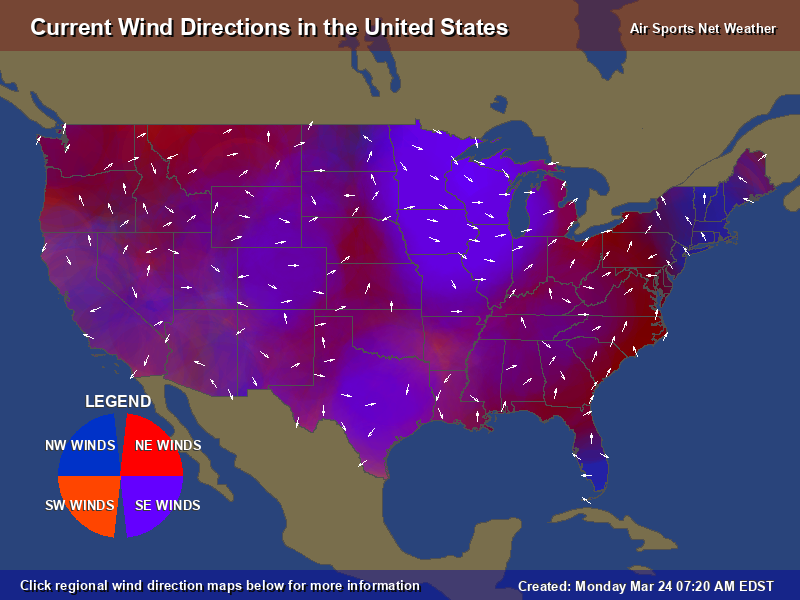
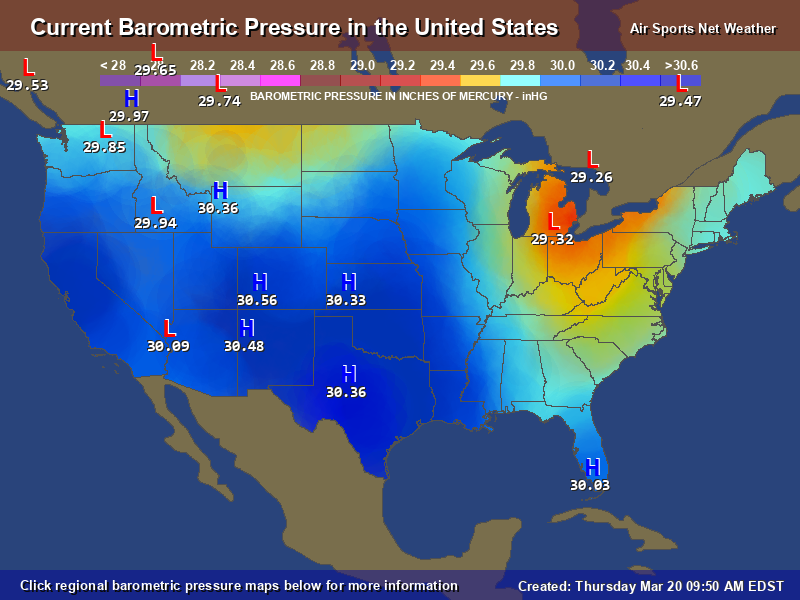
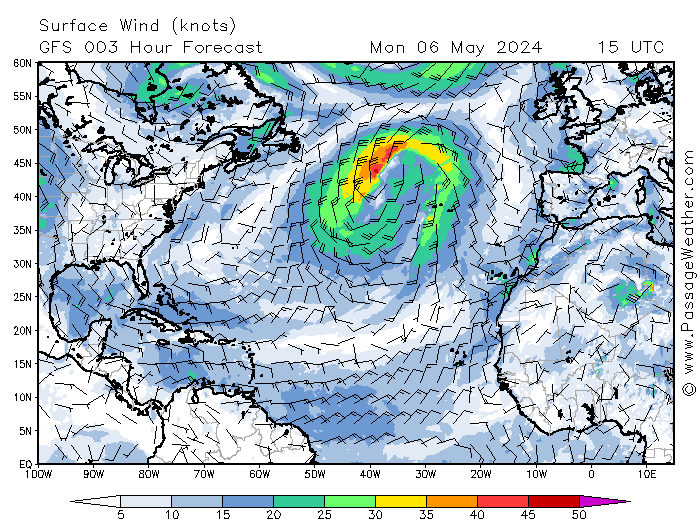
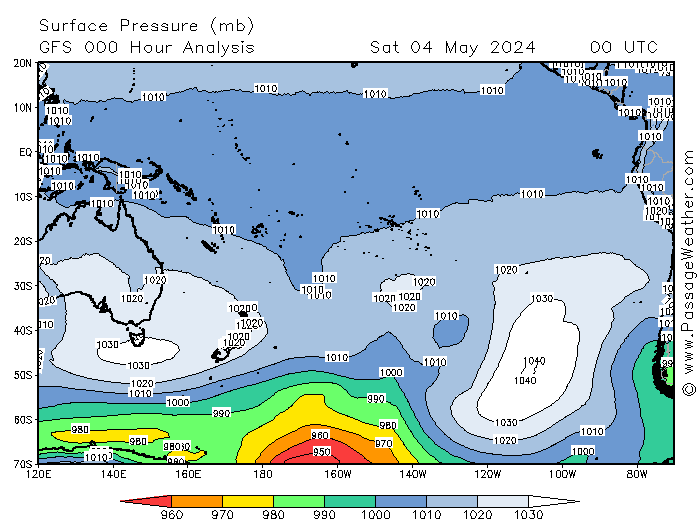
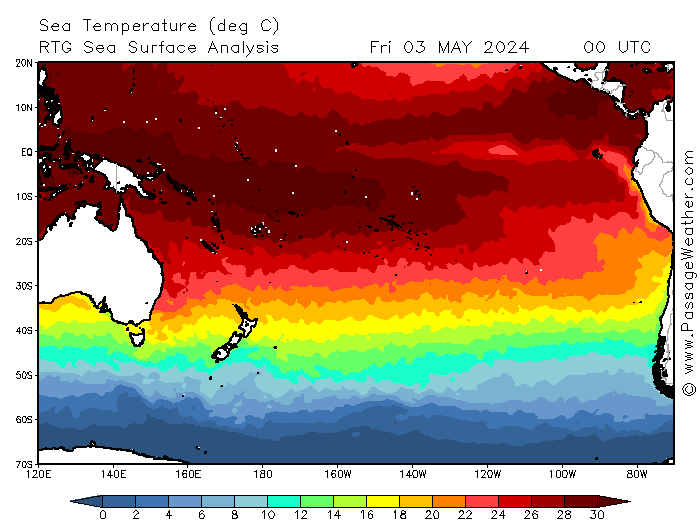
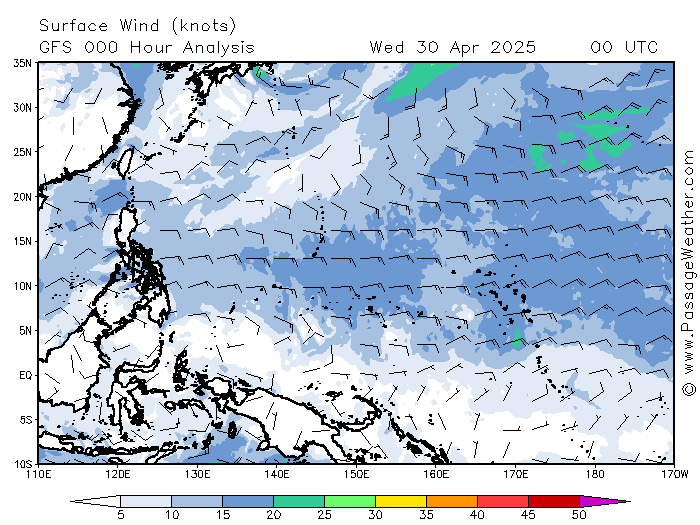
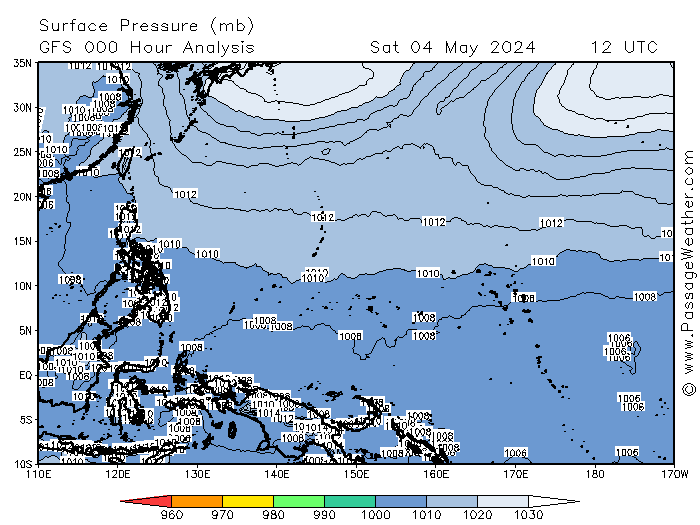
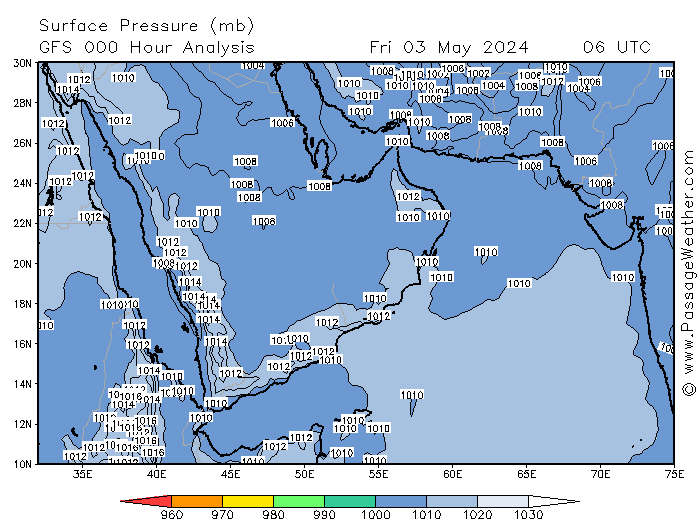
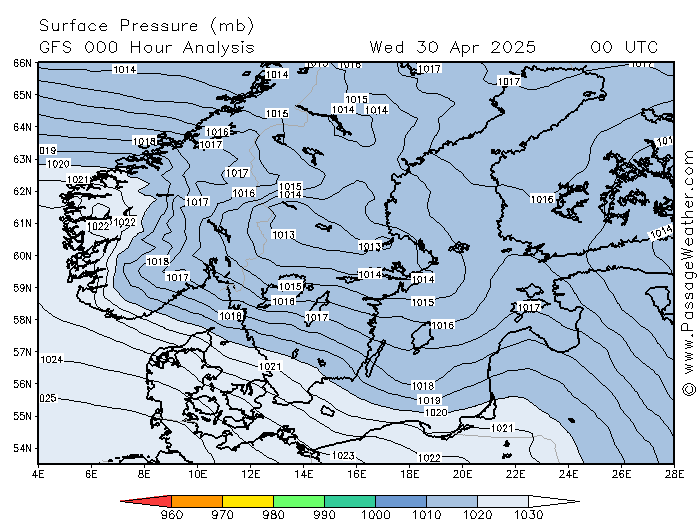
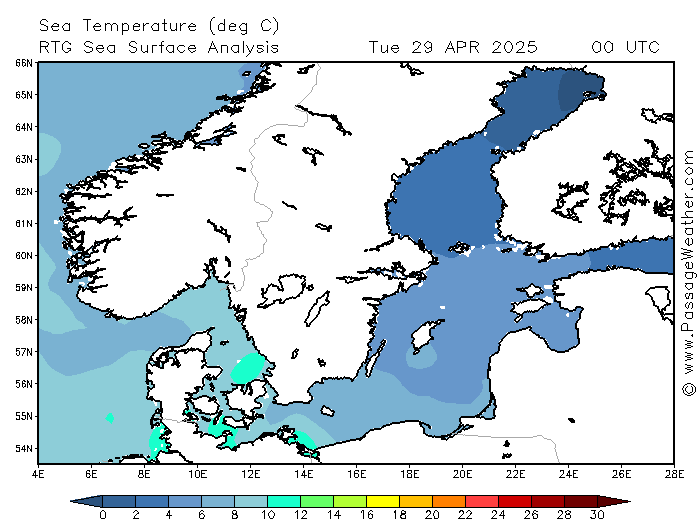
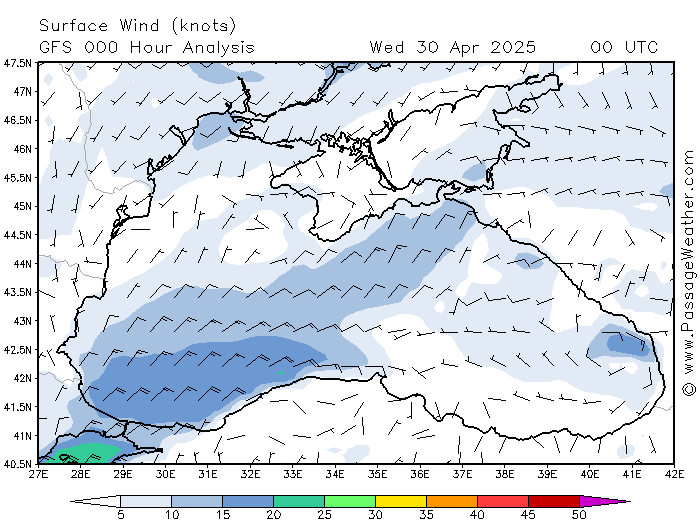
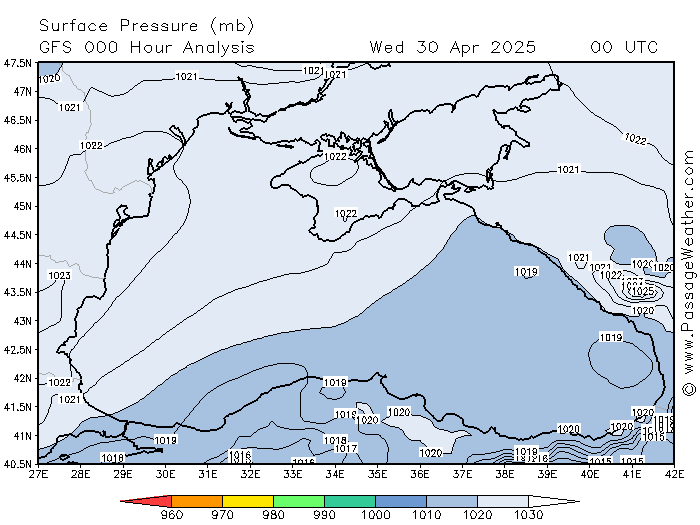
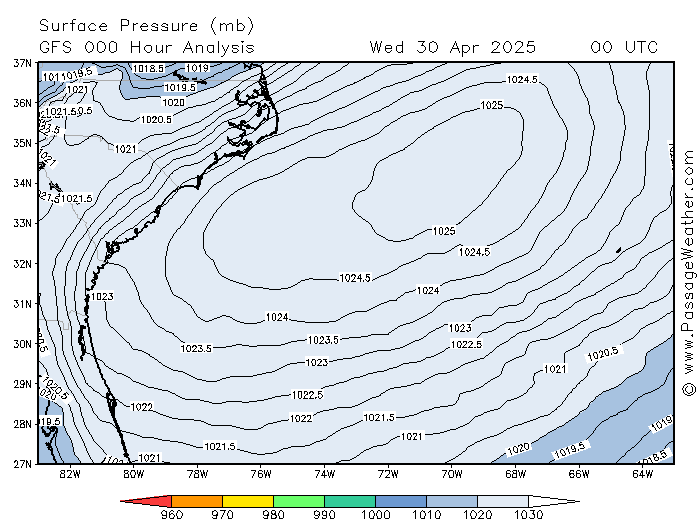
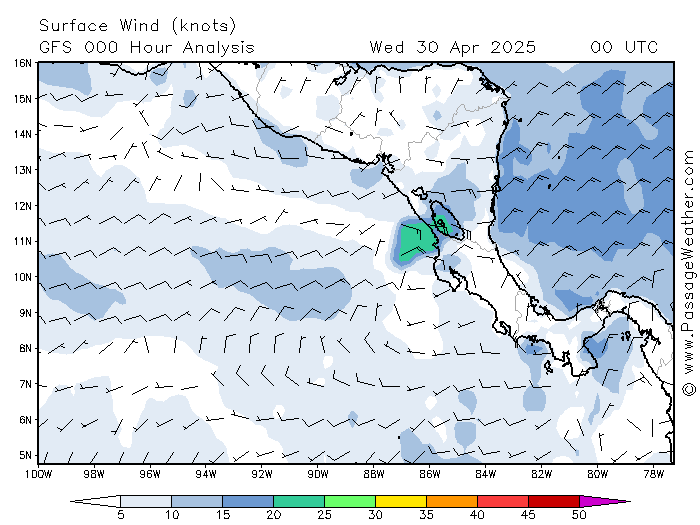
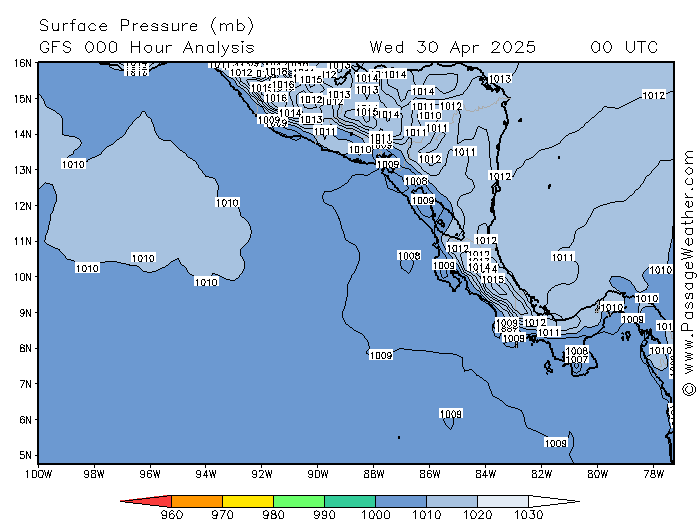
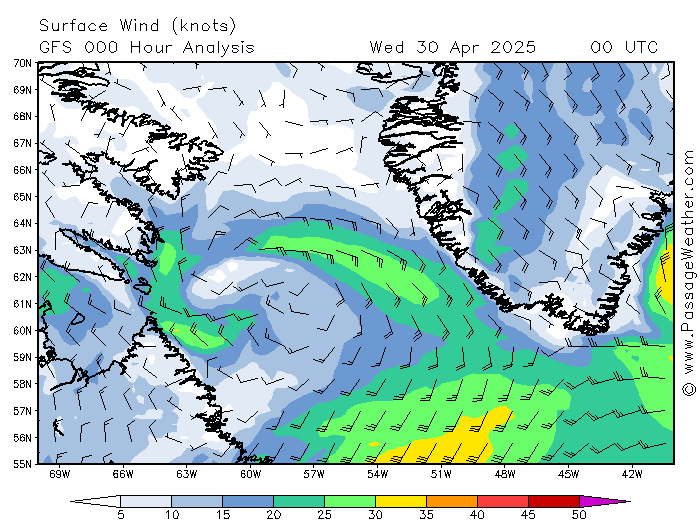
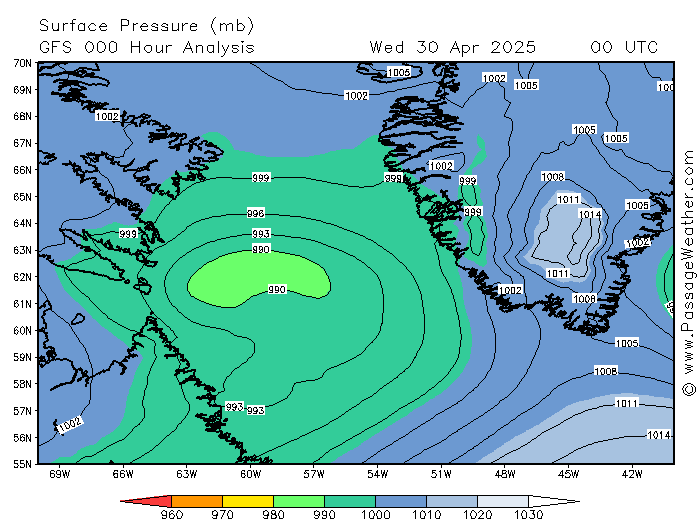
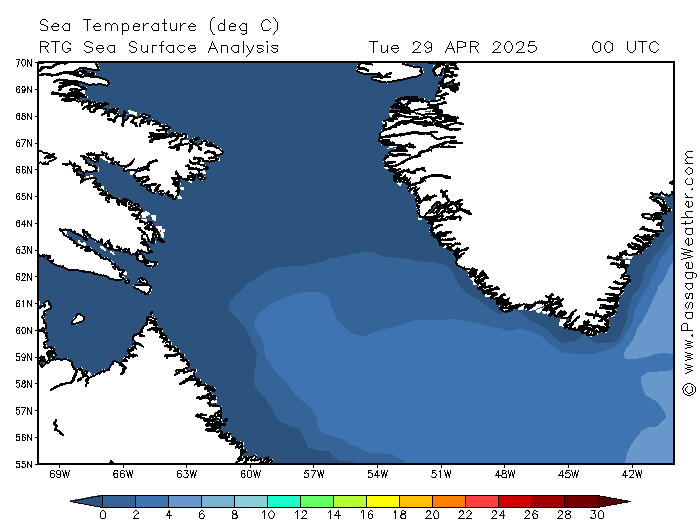
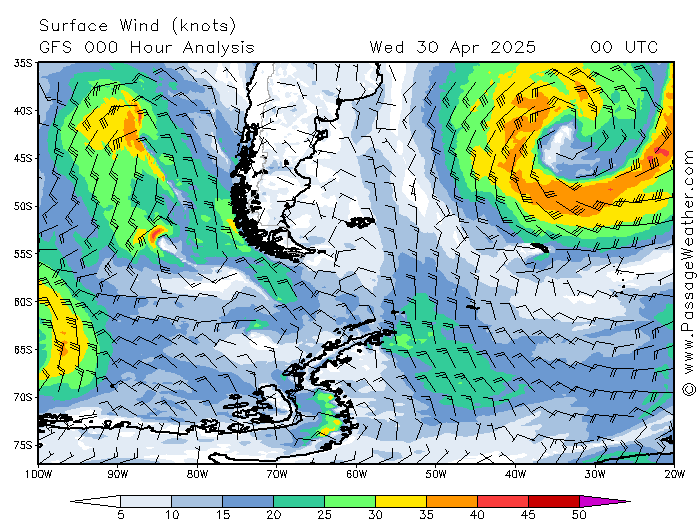
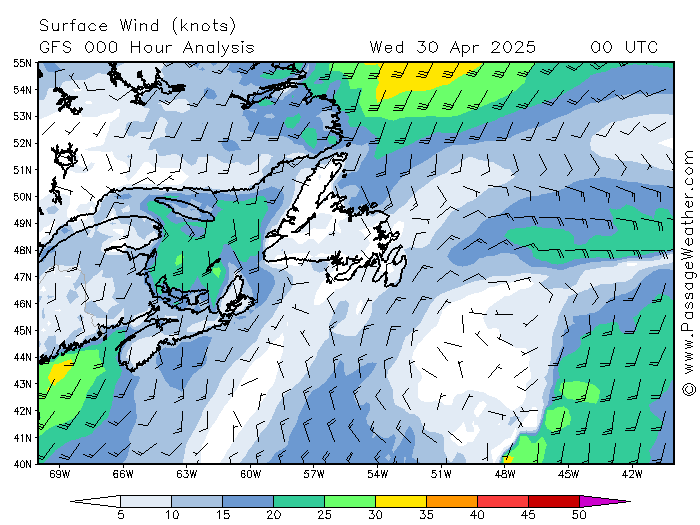
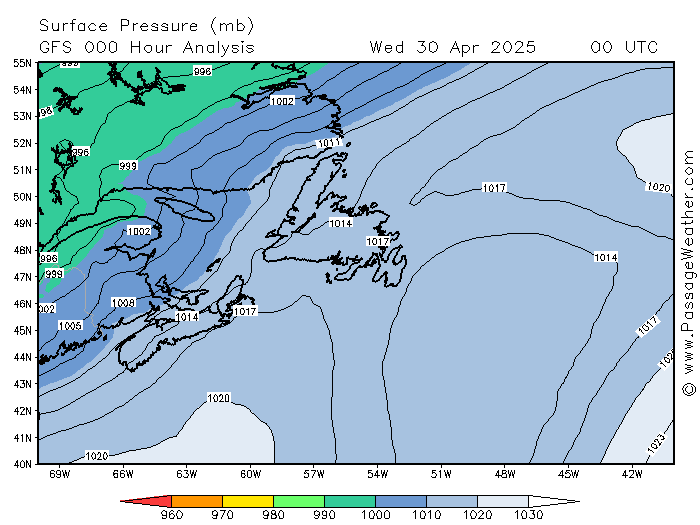
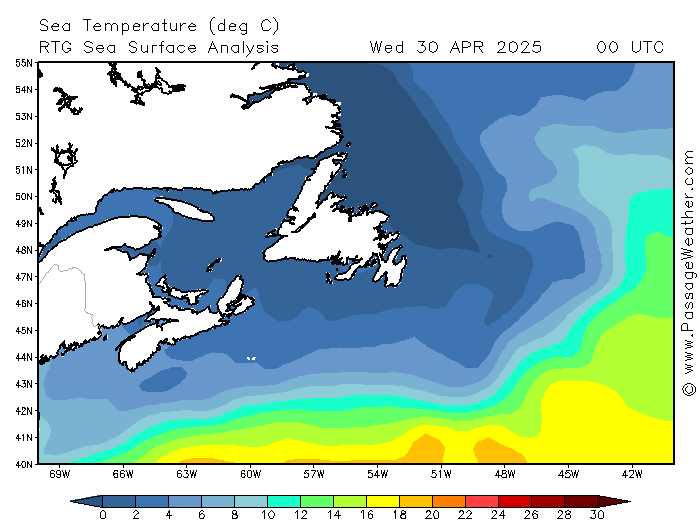
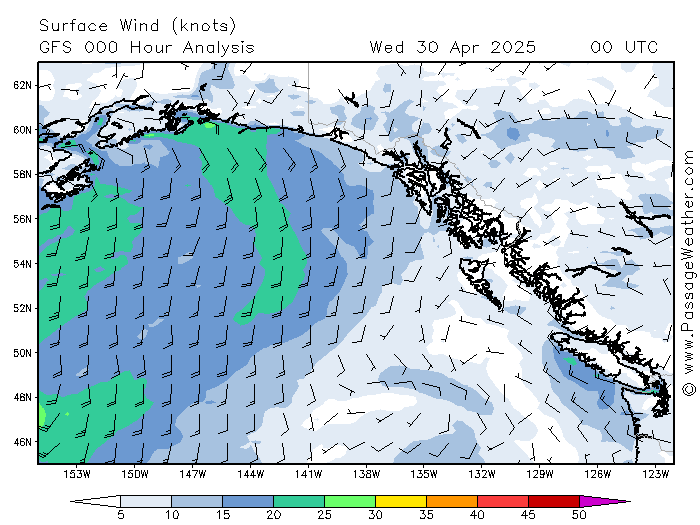
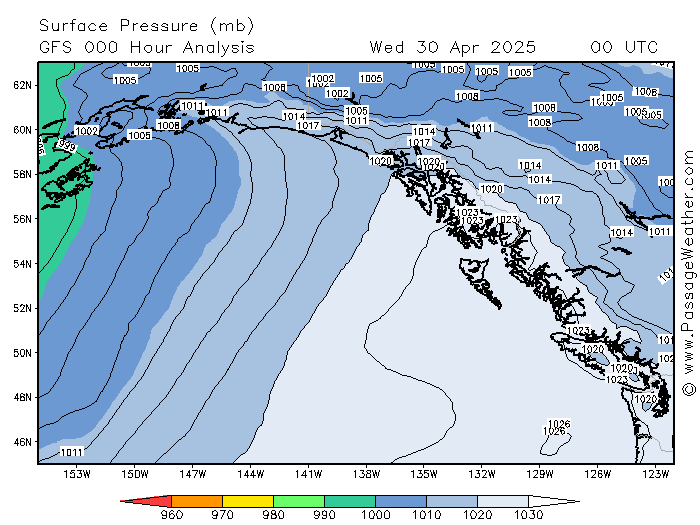
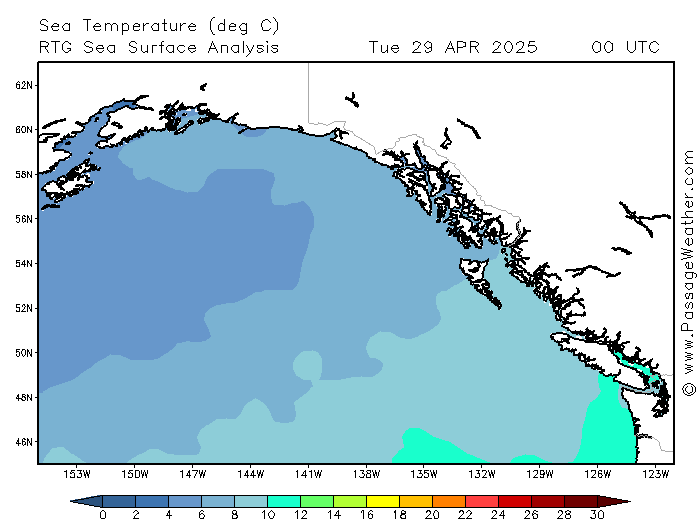
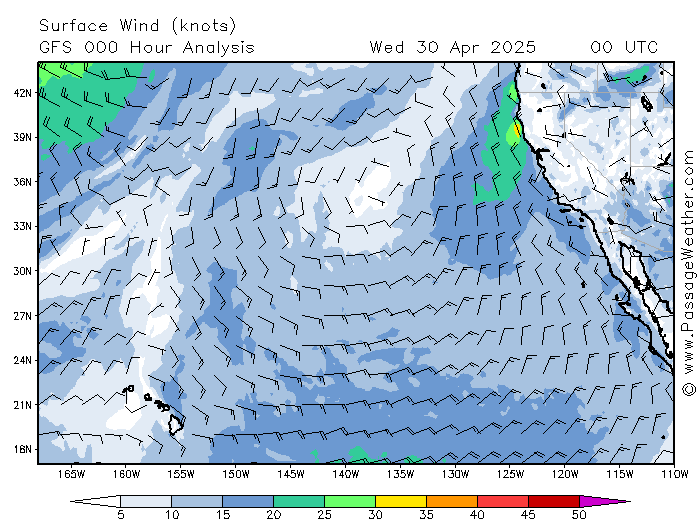
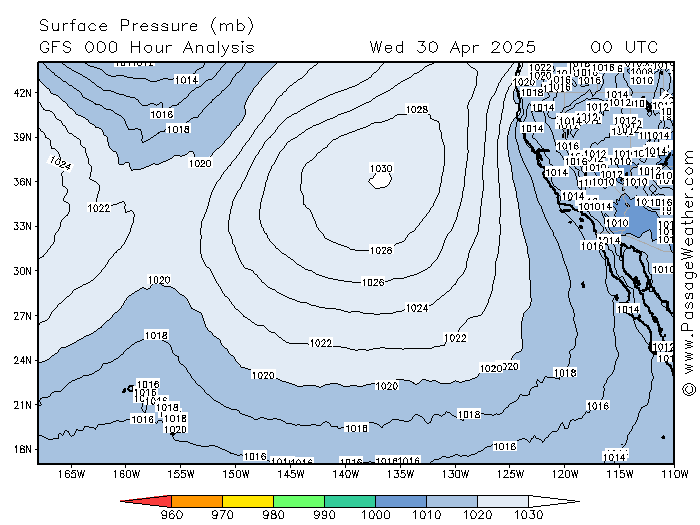
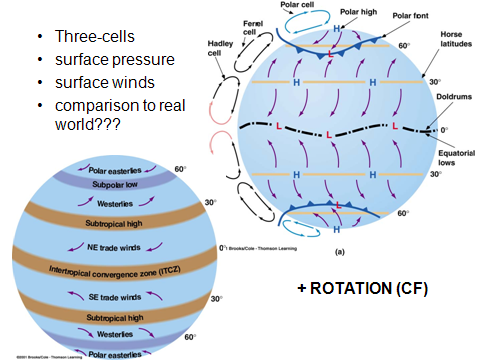
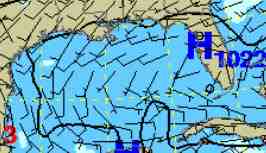
Global Winds and Atmospheric Pressures
Home
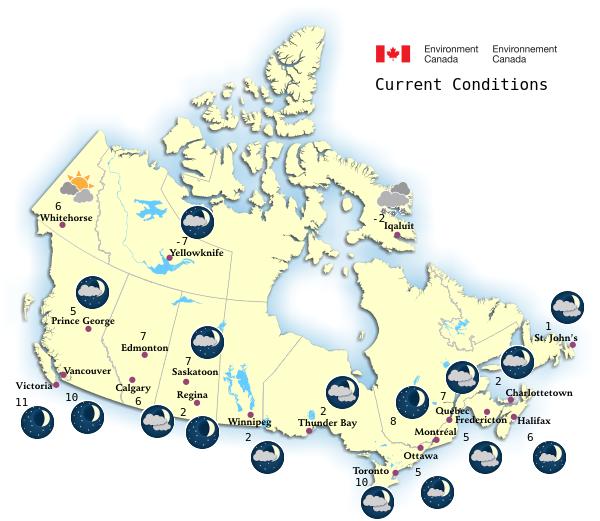
Current U.S. & Canadian Weather
Regional Doppler Radar
Two-Day Forecasts, Precipitation, Winds
Seven-Day Forecast Weather and Winds
Forecast Temperatures Next 10 Days
10-Day Local Weather Links
Winds Surface and Aloft – Current 24hr 48hr
Jetstream 10-Day Forecast
Monthly Average Temperatures
Monthly Precipitation History
Aviation Weather,
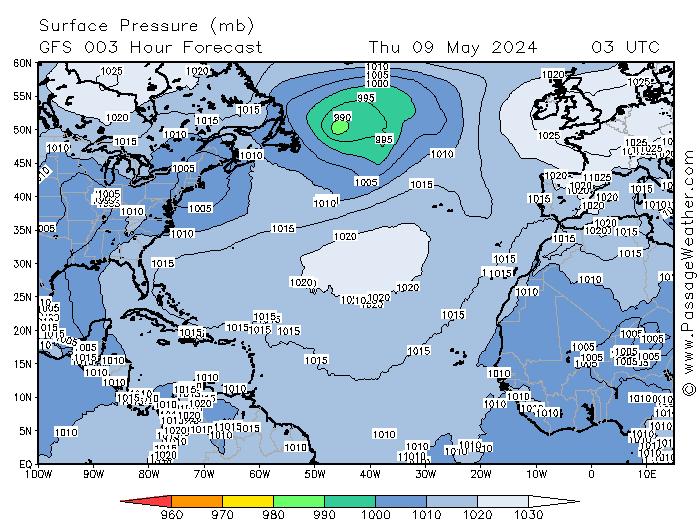
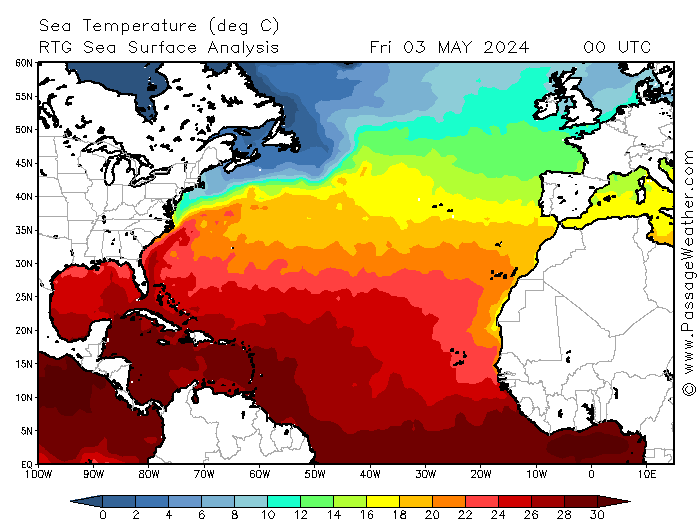
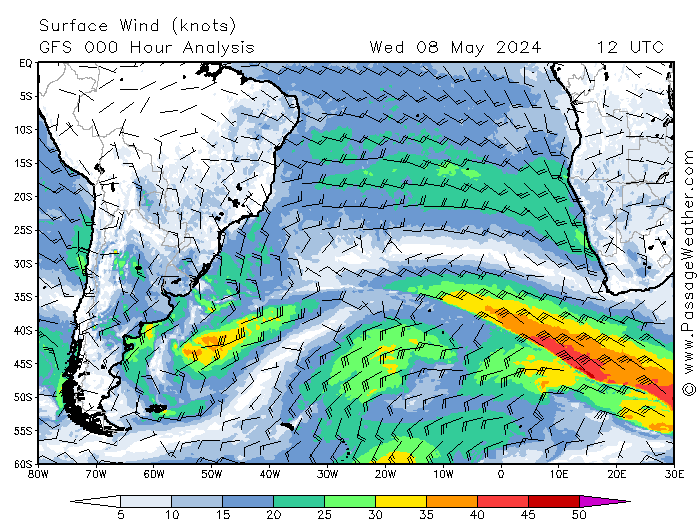
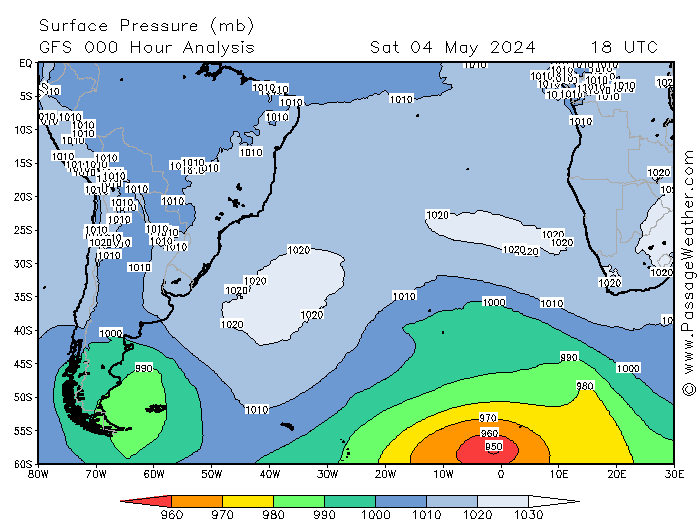
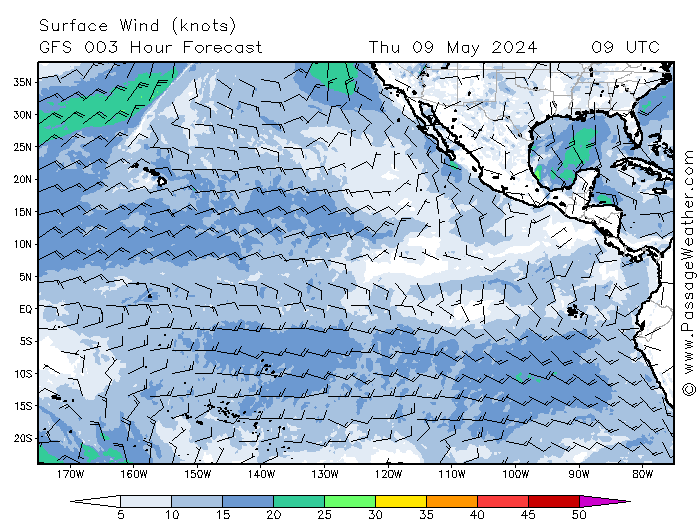
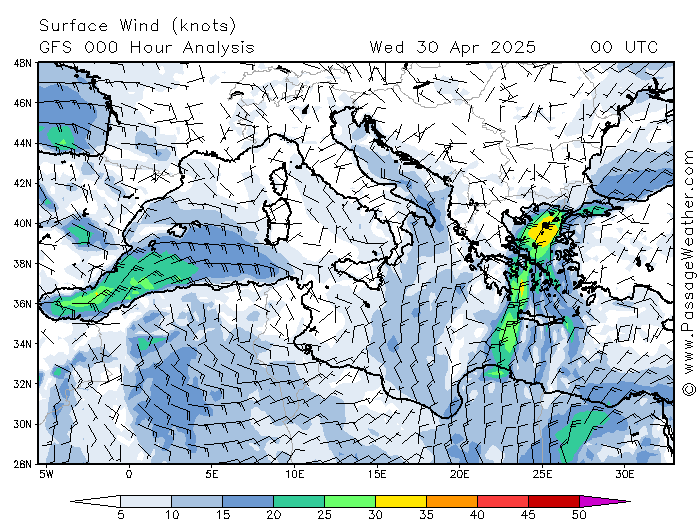
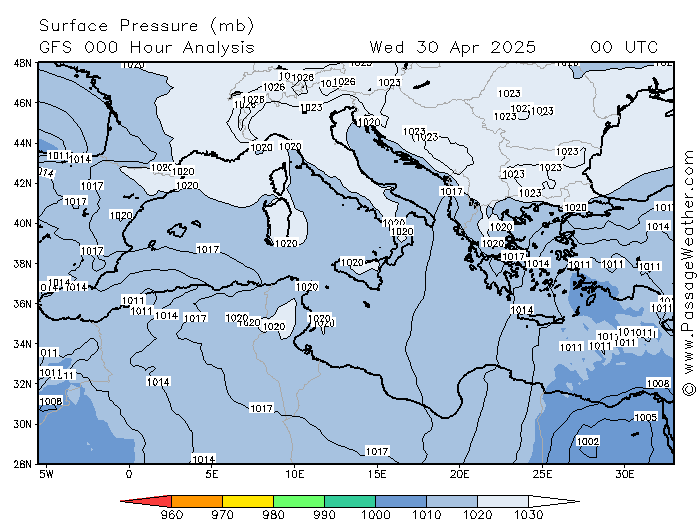
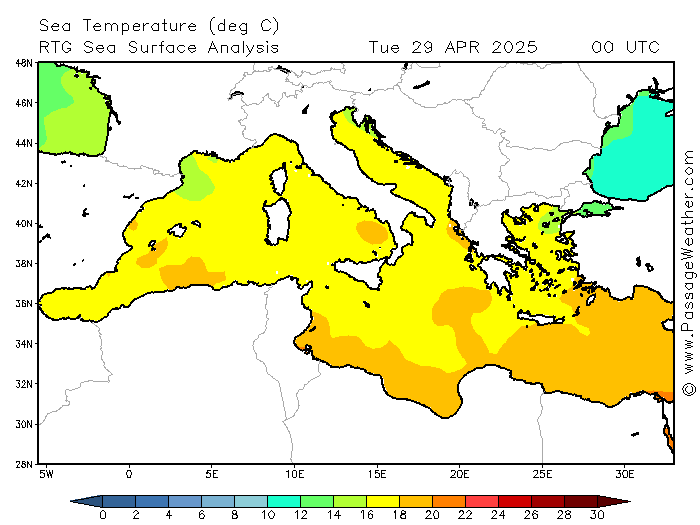
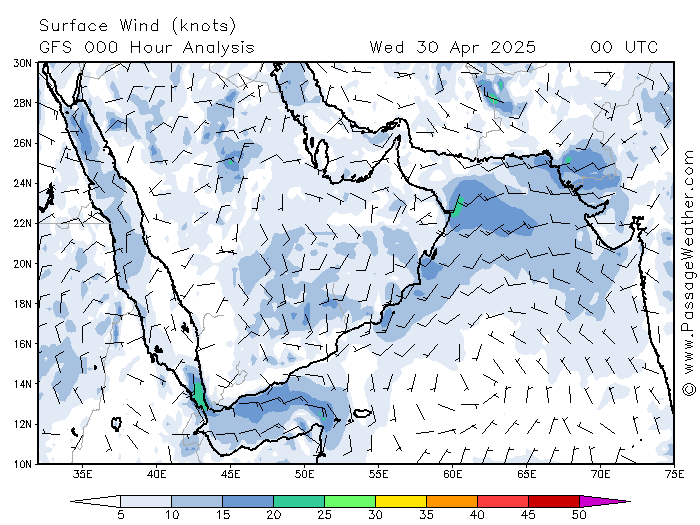
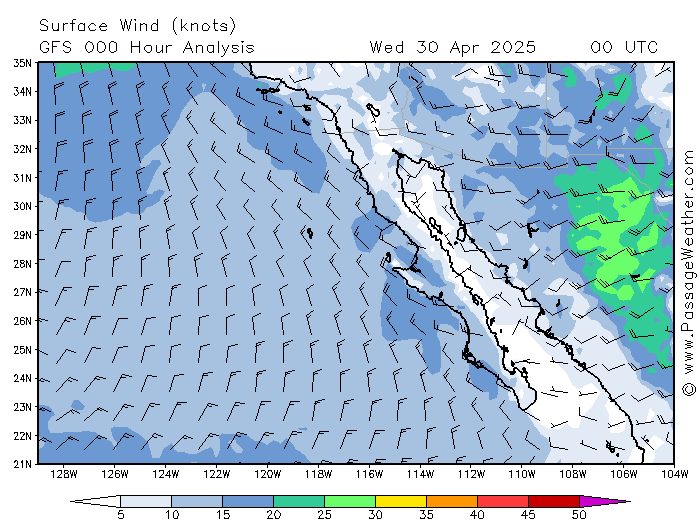
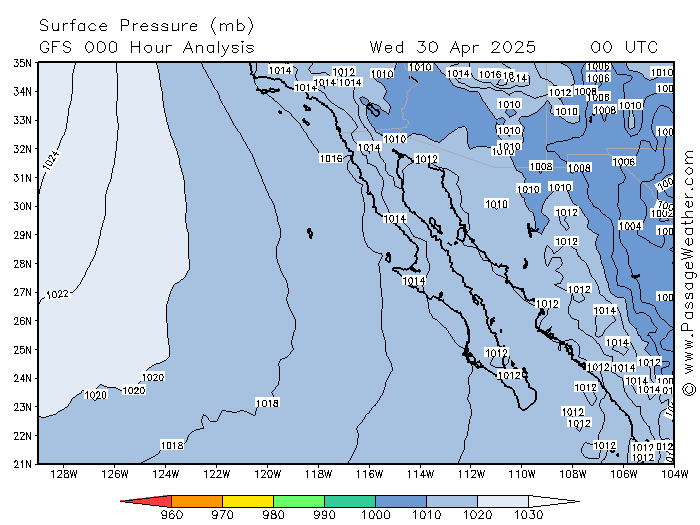
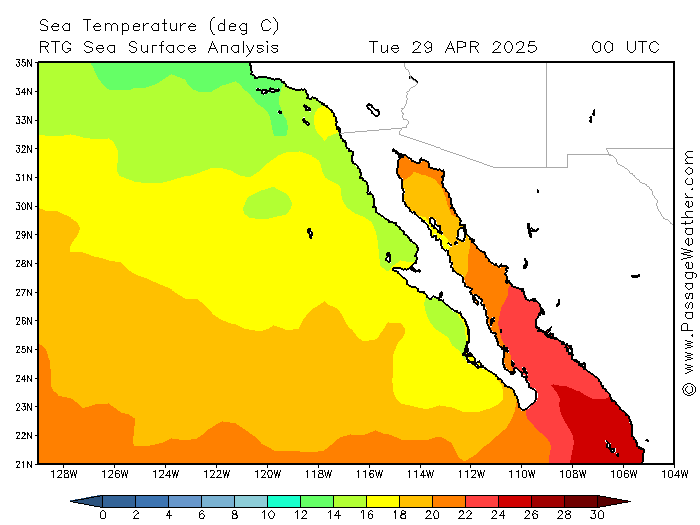
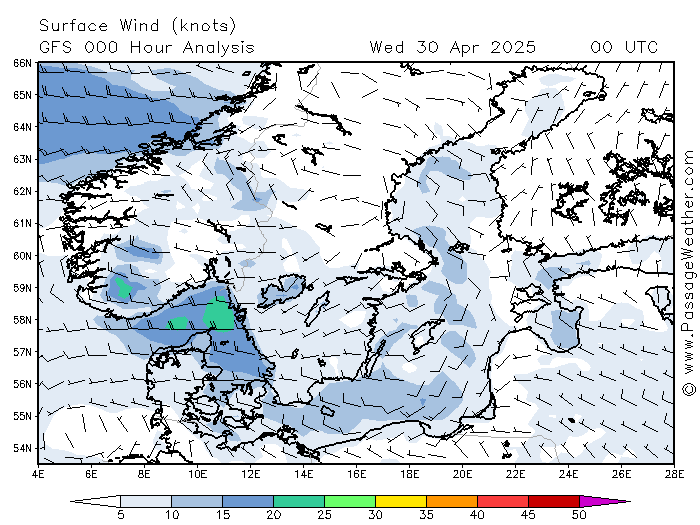
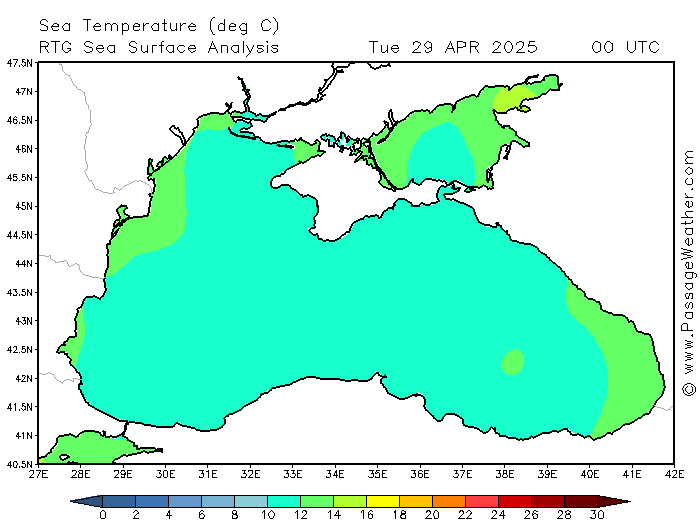
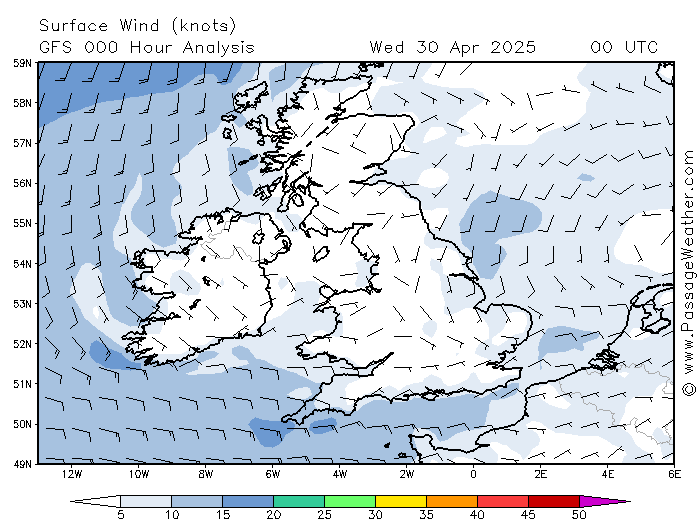
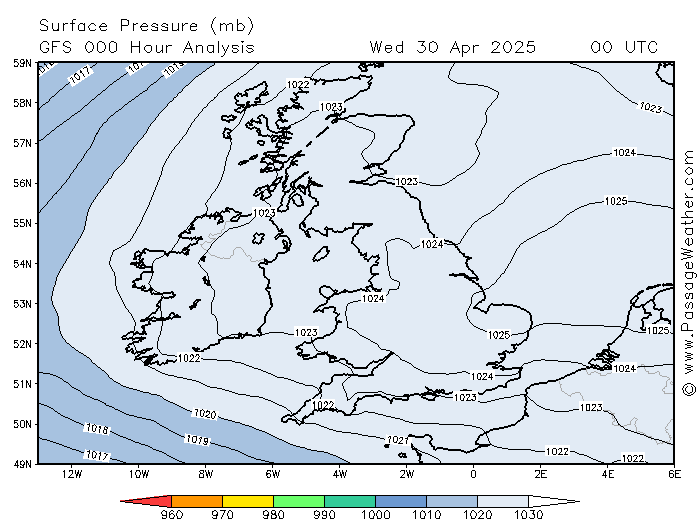
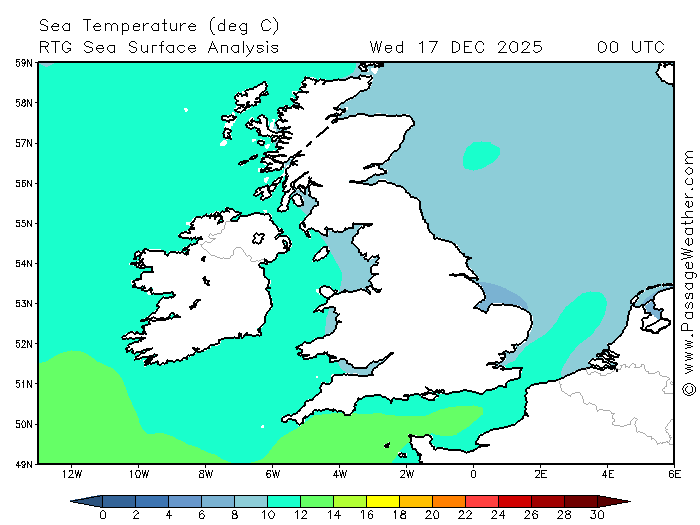
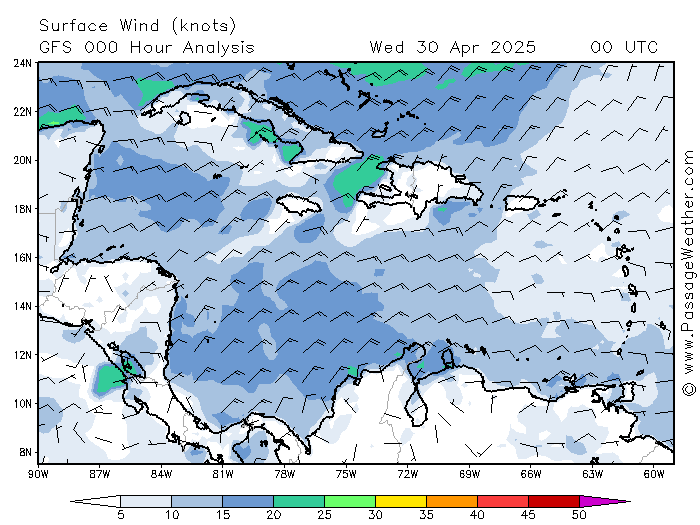
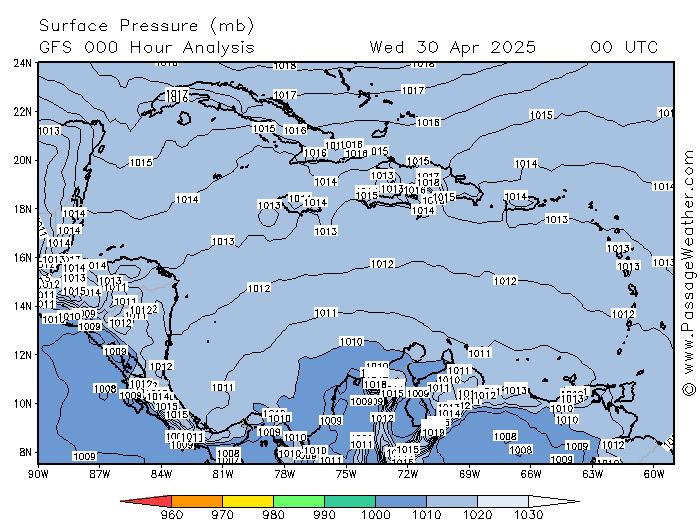
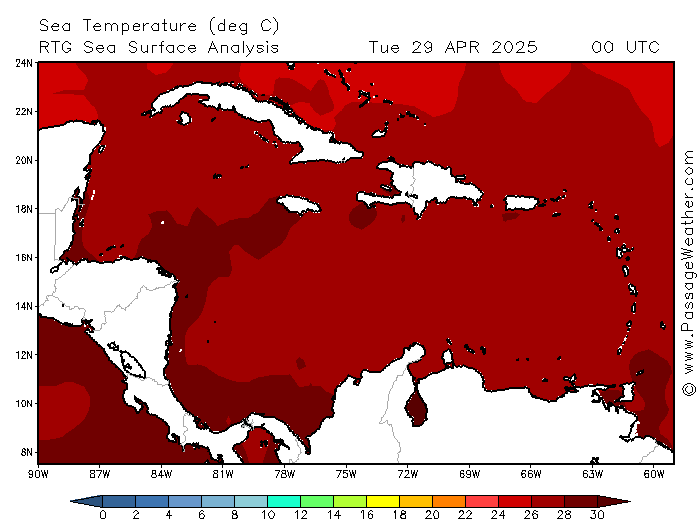
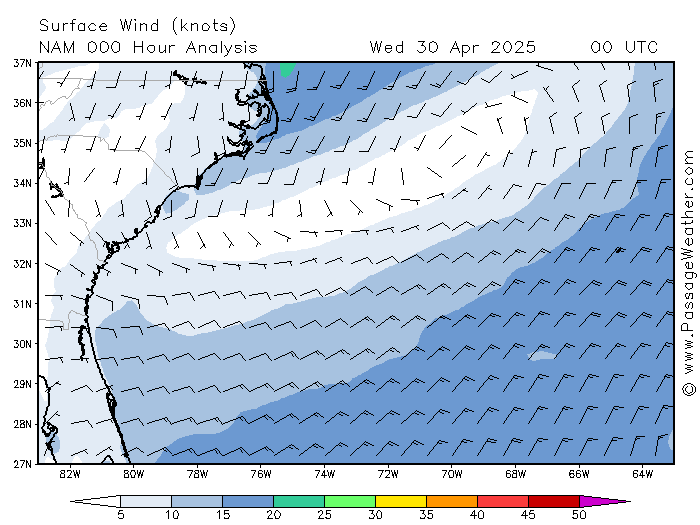
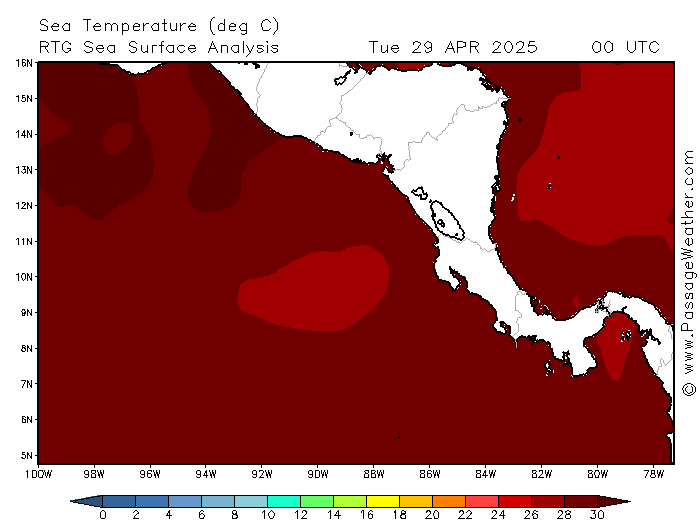
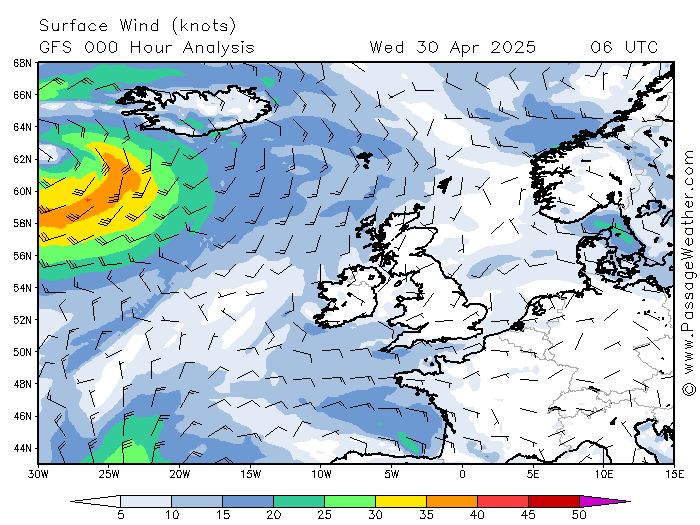
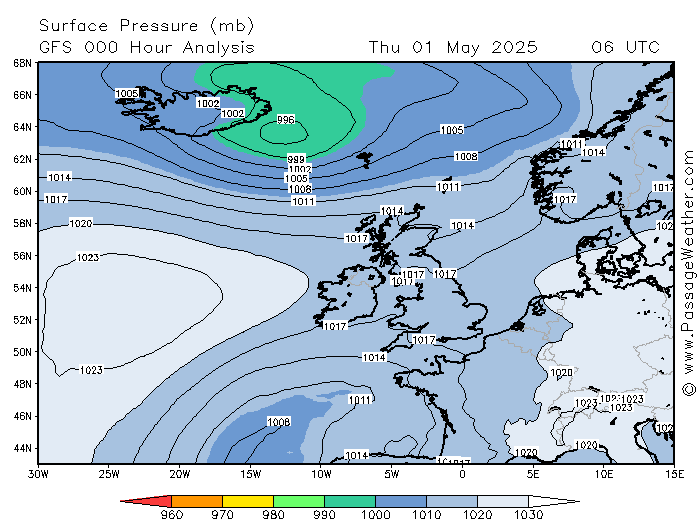
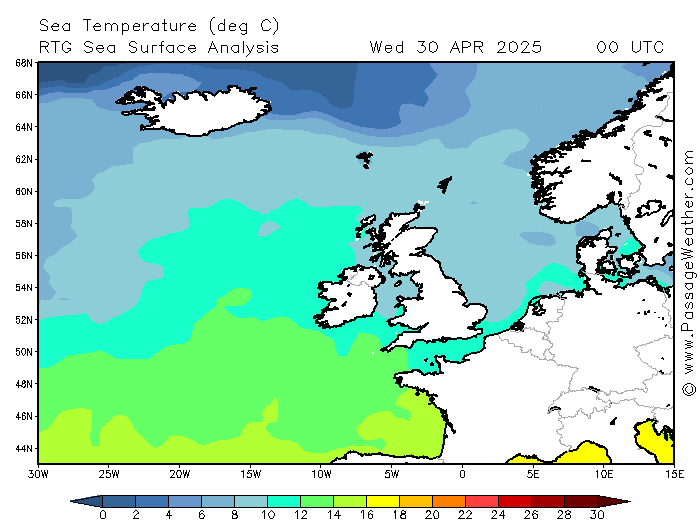
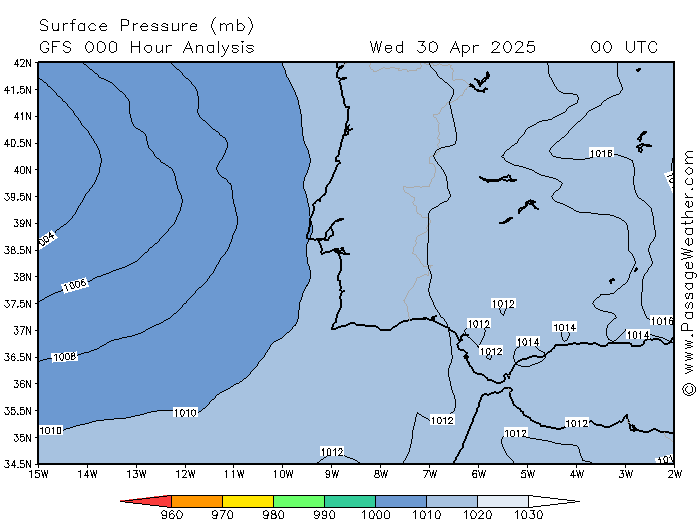
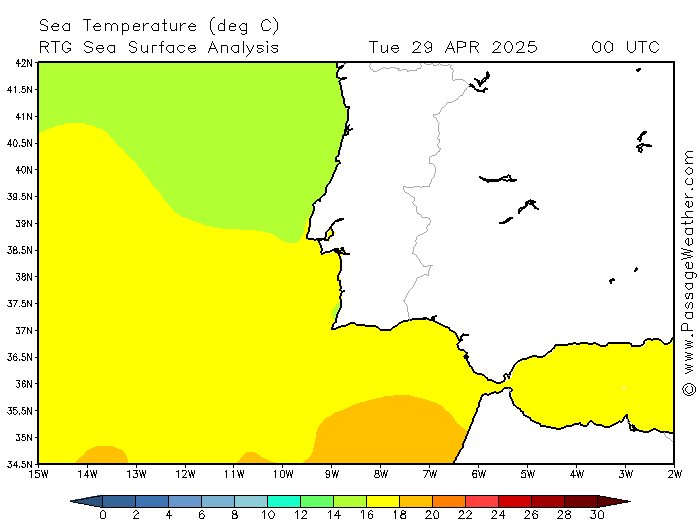
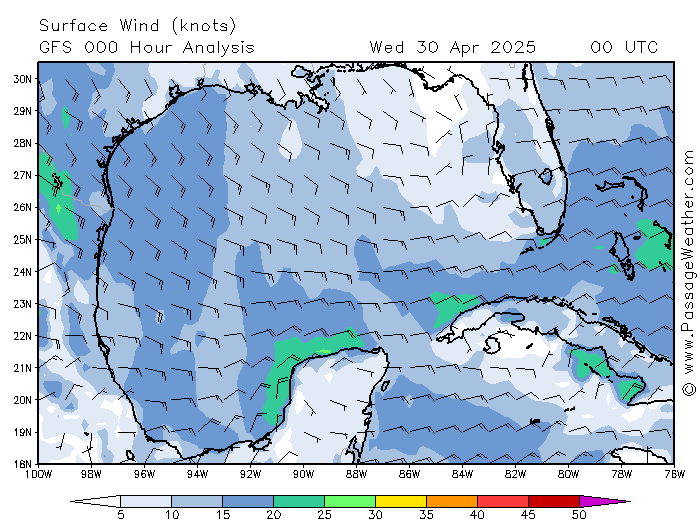
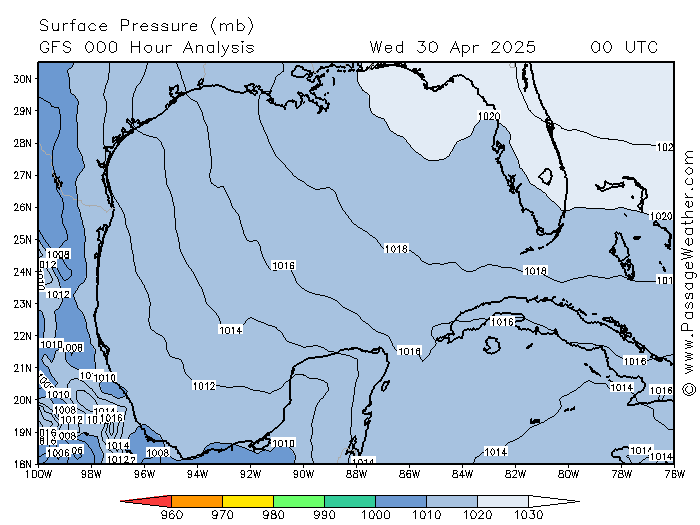
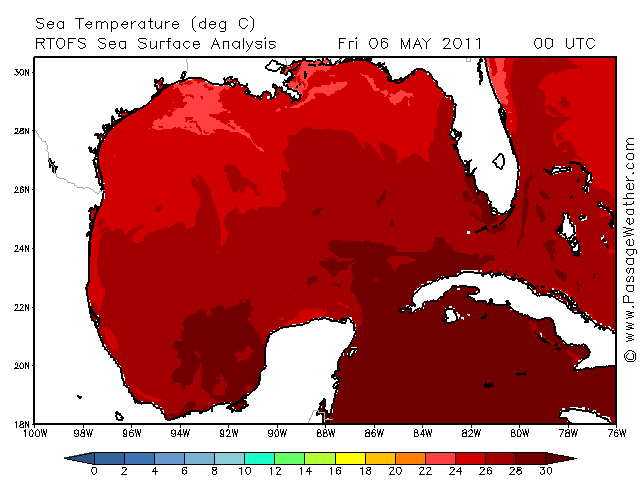
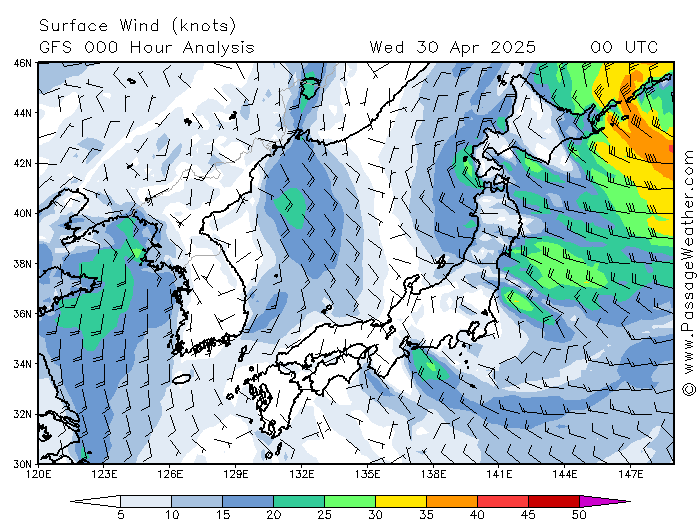
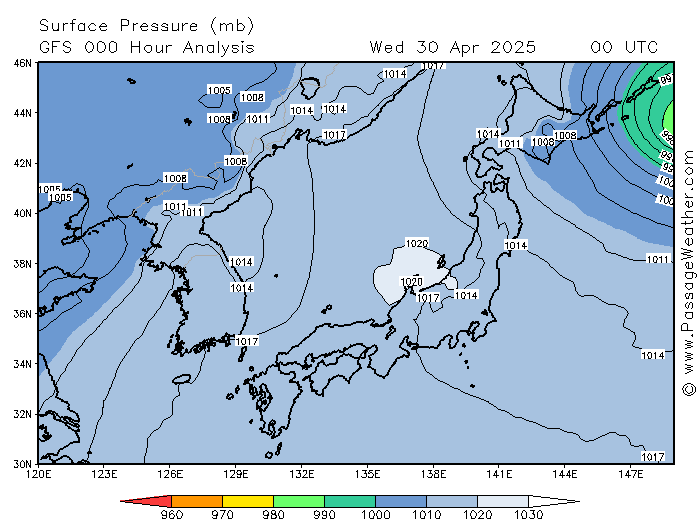
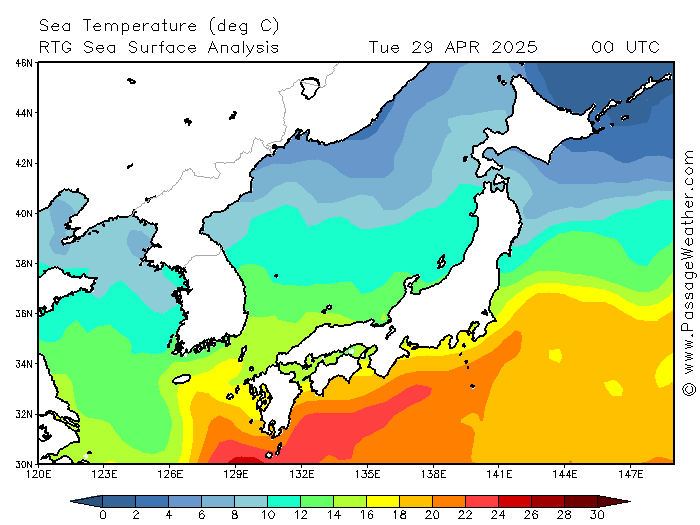
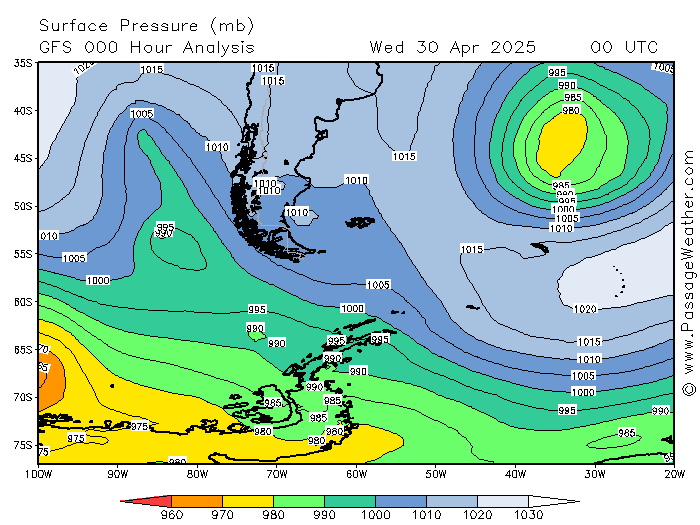
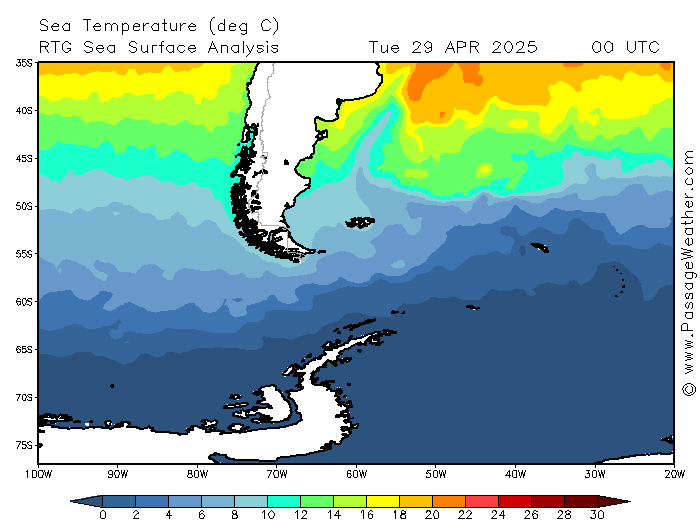
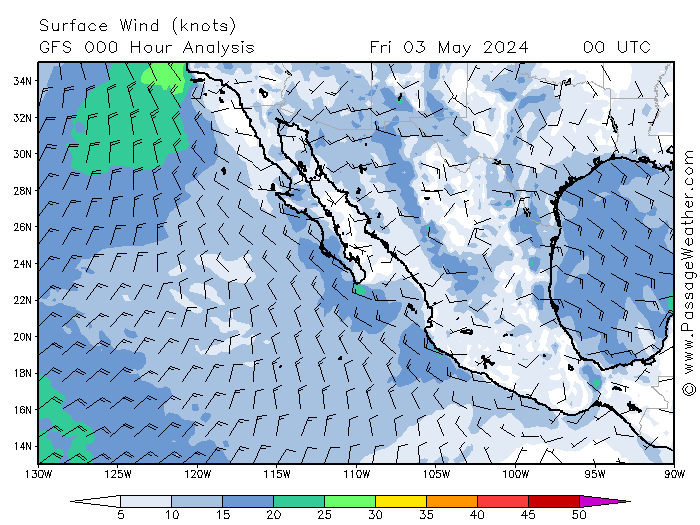
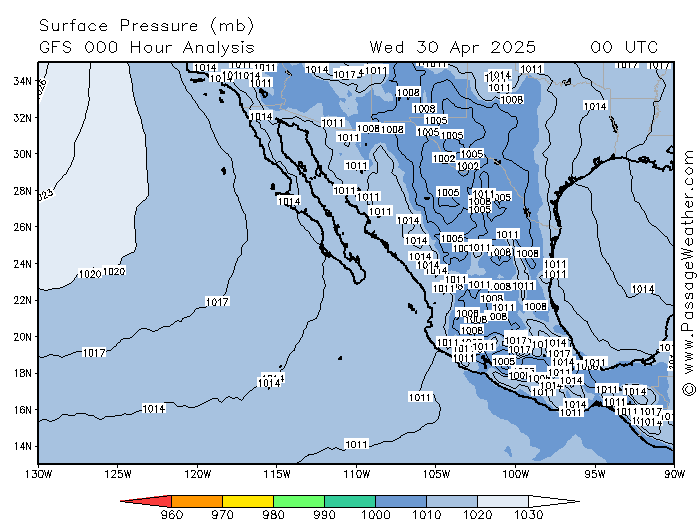
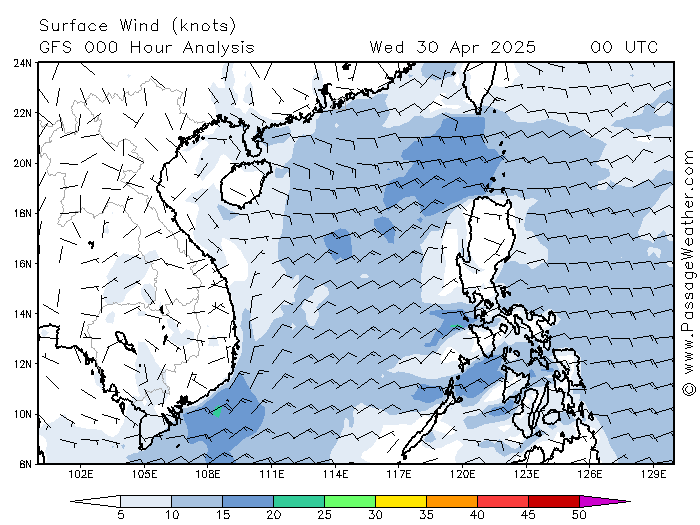
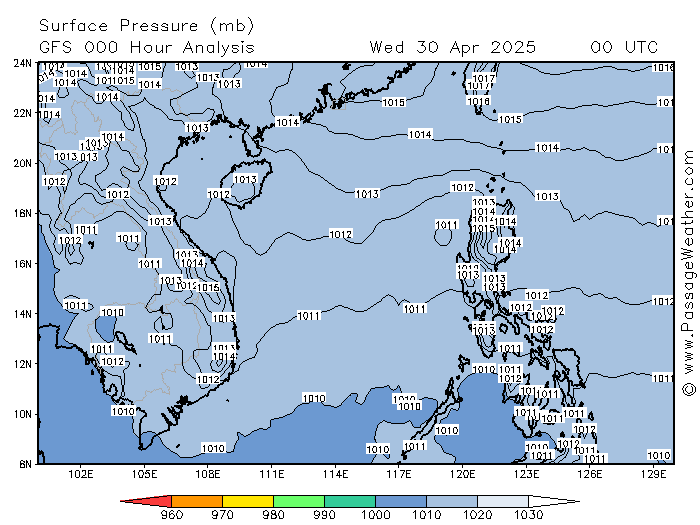
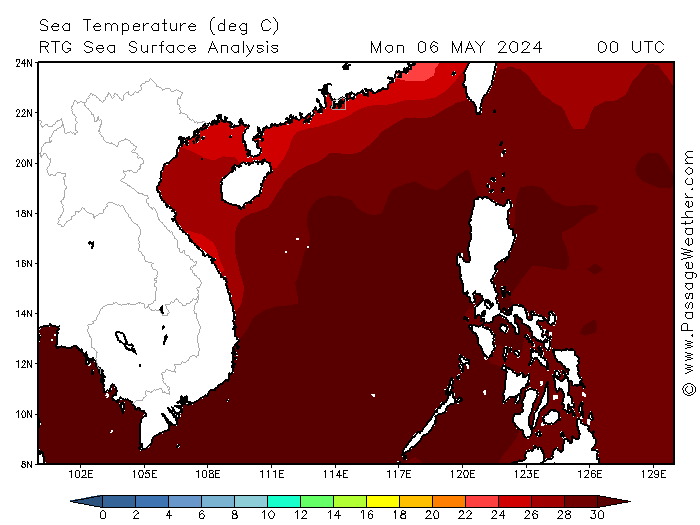
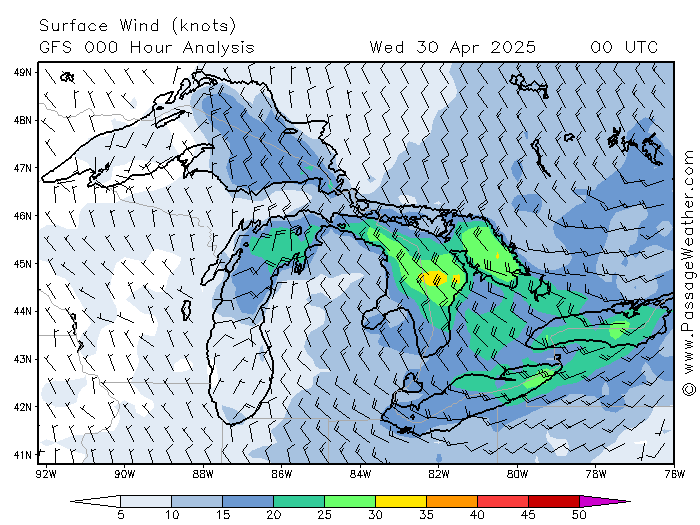
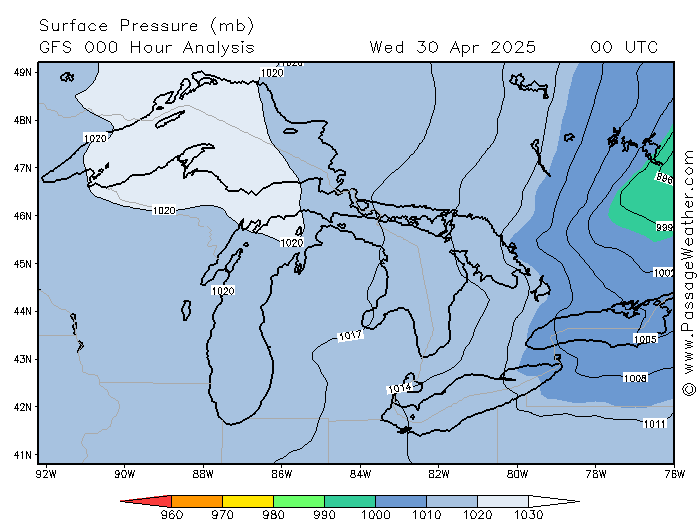
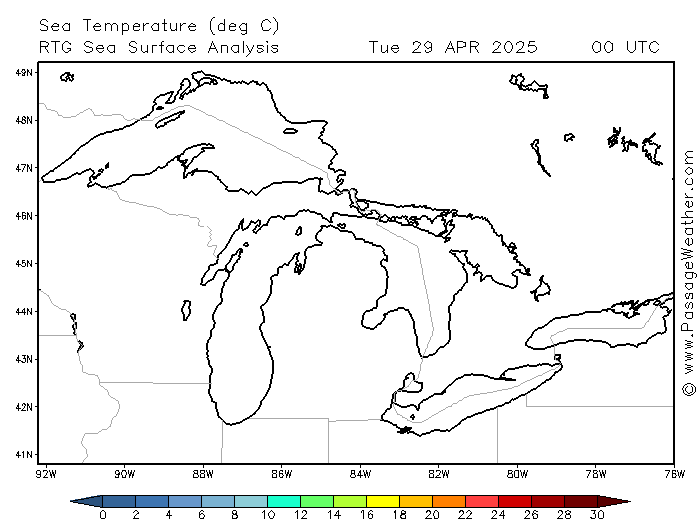
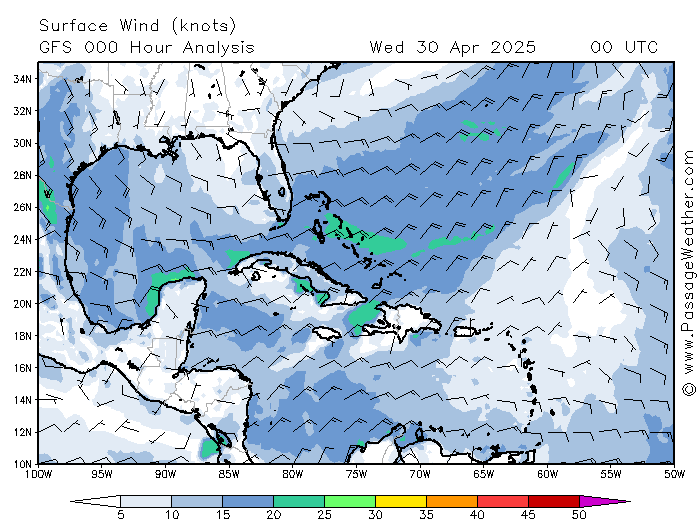
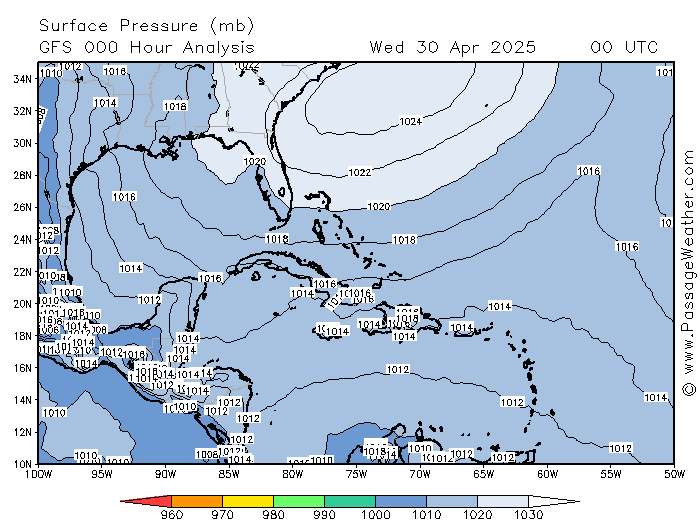
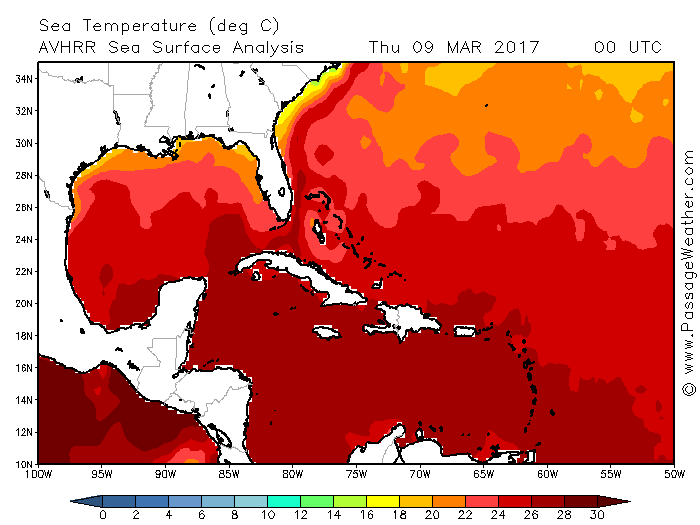
IFR, Ceilings, Icing, Turbulence, Dew Point Skew-T Log-P Charts NOAA Weather Advisory Charts North American Six-Day Forecast Charts Global Winds & Atmospheric Pressure Ocean Weather Ocean Temperatures Americas & Oceania Weather European & African Weather Asian Weather Climate Information Climate News Climate Change Summary The Earth Is Getting Greener! Other Weather Sources Worth Mentioning
IFR, Ceilings, Icing, Turbulence, Dew Point Skew-T Log-P Charts NOAA Weather Advisory Charts North American Six-Day Forecast Charts Global Winds & Atmospheric Pressure Ocean Weather Ocean Temperatures Americas & Oceania Weather European & African Weather Asian Weather Climate Information Climate News Climate Change Summary The Earth Is Getting Greener! Other Weather Sources Worth Mentioning
Commentary Home Page
Hymn to America
Be Glad We in America Do Not Live in a Democracy
Heroes – Nemeses of the Left
The Foundations of Freedom
The Inconvenient Truth About the Democratic Party
Socialism vs. the Business-jet
"Work that lies ahead"
Classroom Socialism – Class Fails
The $88 Trillion World Economy Makes Clear a Lot of Facts
Remembering 9/11
President Trump's First Three Years
Everyone is Smart but Trump
Climate Change - a Political Tool
Politics Trumps Economics Redux
Second Amendment News and Facts
Who Are the Good Guys?
Slavery Today!
Justice Clarence Thomas and the Lost Constitution
Politics Trumps Economics
Why America is Great
Economic Arteries
Socialism guarantees failure and misery,
so why do so many Americans want it? And More ...
so why do so many Americans want it? And More ...